So you’ve got your chosen analytics tracking set up and it’s recording stats-a-plenty, but how do you see how users actually interact with your site? Enter website heat mapping tools.
The raw data in your analytics dashboards can tell you how many visitors and clicks you had or how long they stayed on each page, but within the figures there’s no real understanding of what the user actually did on the page. Enter website heat mapping and session recording.
These tools allow you to track individual clicks, mouse movement and scroll interactions on a page, resulting in a heat map of activity. The ‘hotter’ the colour, the more activity that area of the site has received. While session recording literally records a video of a user’s interaction on a page, allowing you to see a session replay of what they clicked on, how they ‘viewed’ the site, entered data into a form and interacted with dynamic elements.
Here’s a shortlist of some great platforms you should definitely take a look at if you’re looking to bolster your website heat mapping.
Full Story
Website: https://www.fullstory.com/
Pricing: $199/m, $399/m, $849/m, for an increasing number of sessions per month. A bespoke pricing option is available for sessions over 500k.
“FullStory lets your company easily record, replay, search, and analyse each user’s actual experience with your website. Think of it as your team’s super-searchable DVR for all customer interactions.”
A recent client of mine was using this on their new site and was I stunned by the data it captured. It literally records entire user sessions on your site so you can track, and see, exactly what the user does; where their mouse cursor goes, what they click on, what forms they fill out and more. This is really useful information in itself, however you can also see common patterns of usage and clearly see where users are ‘going wrong’ or using your site in an unexpected way – really useful information you just don’t get from traditional analytics platforms.
The session videos make use of a clever timeline which displays every user event as a series of dots and dashes allowing you to jump to a specific event quickly and easily. FullStory also has a really smart feature for resolving bugs – it displays the complete JavaScript console at the time of each user interaction – which as a developer was invaluable for resolving issues during testing and the soft launch periods.
FullStory has some great integrations to you can add value to your existing Google Analytics dashboard, or link up to ZenDesk for a complete bug logging and resolution solution. If you have the skills, or know someone who has, you can always go one step further and integrate FullStory with your own app or platform via their JavaScript API.

Crazy Egg
Website: http://www.crazyegg.com/
Pricing: Basic $9/m, Standard $19/m, Plus $49/m, Pro $99/m for increasing levels of user visits, active tracked pages and other added functionality.
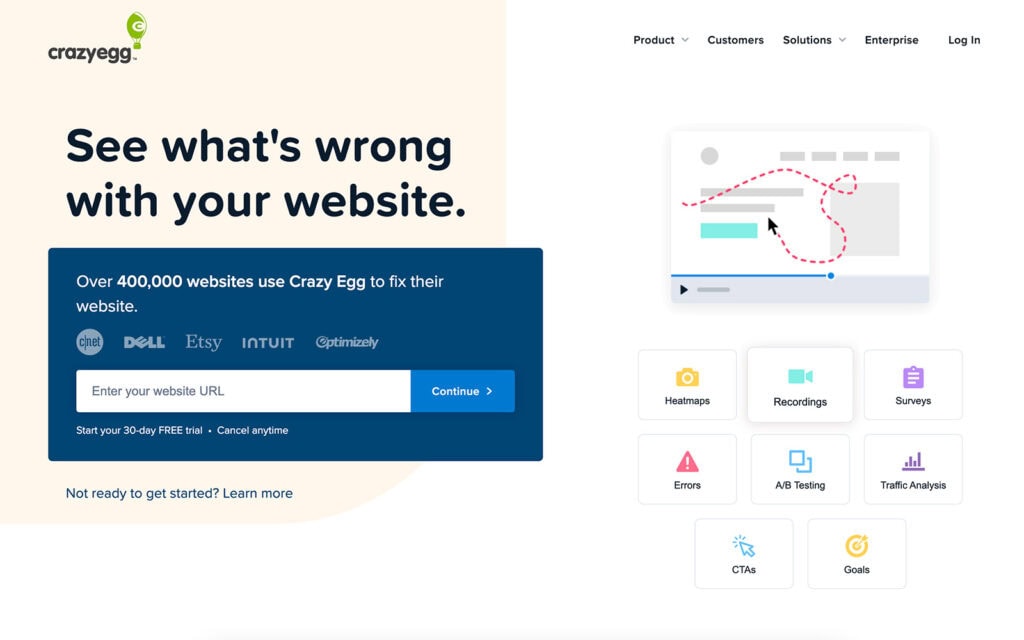
CrazyEgg is a website heat mapping tool which tracks user interactions (clicks/taps), rather than traditional eye-movements, to create a heat map of activity. You can configure the software on as many pages as you need and it’s great for getting a visual map of the most clicked links on the site. The reports can also give insight into areas of UI which are perhaps not working as expected. For example when I used CrazyEgg on a client site we noticed that very few visitors were interacting with a content slider on the homepage. It was made clear by the heat map that no one had noticed the subtle buttons to the sides. So we changed the design, made them more obvious and added a nice pulsing effect and then almost immediately saw interactions on those buttons as users saw there was more content available.
CrazyEgg also produces reports for scroll mapping – great for long single pages sites, click overlays and a confetti report which allows you to really drill down into each click on your site, segmented by source, referral, search terms and more.
Lucky Orange
Website: http://www.luckyorange.com
Pricing: Starter $10/m, Small Business $20/m, Medium $50/m, Large $100/m for increasing levels of page views, sites and operators. 7-day trial and Enterprise level tier available.
Lucky Orange is almost an amalgamation of Full Story and Crazy Egg. It records user sessions which you can then play back and review, but also converts those sessions into aggregated heat maps for each page.
It’s really easy to filter the user sessions and segment by browser, OS, referring source, location, device and more. If you’re running an online store or other bespoke data structures you can pass in additional fields to filter on such as Order ID, Customer ID or product name for example.
The heat mapping is a little more advanced than that of CrazyEgg, recording movement tracking as well as click tracking and scroll depth. This means as the user moves their mouse across the screen the cursor movement is recorded. LuckyOrange call this a “poor man’s eye tracking” but it can give a reasonable measurement of what people are looking at as they move their cursor across the screen following what their eyes are looking at.
The added bonuses of LuckyOrange are the built in chat and polling features. The chat feature adds a subtle chat button onto your site which allows your customers to connect with you for assistance, should they require it. Alternatively, you can set up some intelligent queries to automatically open a chat window if certain criteria are met, for example, if the user has been on the checkout page for more than 120 seconds without proceeding.
The polling feature allows you to capture additional information from the visitor about their experience by asking a simple quick question specific to that element of the customer journey.
One last feature worth a mention is the form analytics which supplies five key metrics on the usage of your forms; abandonment, time to start, field time, average order and repeated fields. These give some really useful usability stats which can help you improve your forms and thus increase conversions.
Arguably one of the biggest selling points of LuckyOrange is you can get all these features from as little as $10 per month. No reason not to give it a go then.
Mouse Flow
Website: https://mouseflow.com
Pricing: Small $15/m, Medium $59/m, Large $119/m, Extra Large $299/m for increasing levels of recorded sessions, sites and storage. A free plan and Enterprise level tier available.
MouseFlow is a bit like a stripped down version of LuckyOrange allowing you to record user sessions and track mouse movements and clicks, to produce heat maps of user interactivity. MouseFlow allows you to track activity from mobile and tablet usage (as much of the other examples on this list do) and also tracks the source, referral, OS and browser data.
MouseFlow has a nice filter feature on its heat mapping, allowing you to select different reports based on Clicks, Hovers, Hover to click rate, Hover order, Time before click and many more. This added level of detail can provide you with a more granular picture of what your visitors are doing on your site. It also has a nice Attention heat map which displays where your visitors are most engaged.
A bonus to users of WordPress is the plugin which allows you to bolt MouseFlow directly into the WP CMS. A lot of the other platforms don’t have this sort of integration, so this could swing the deal for some users.
At the time of writing, there is a beta of the New Mouse Flow which you can sign up to and we can only expect a richer feature set to rival the other big players in the ‘website heat mapping’ sector. Check it out.
Inspectlet
Website: http://www.inspectlet.com
Pricing: Free, Micro $39/m, Startup $79/m, Growth $149/m, Accelerate $299/m for increasing levels of recorded sessions, sites and other added features. An Enterprise level tier is available.
Inspectlet is another big player in this arena. With its offering of session recording, session replay, website heat mapping (click, movement and scroll maps) and form analytics, it’s comparable to LuckyOrange bar the chat and polling.
Most of the features operate in much the same way as LuckyOrange. The form analytics tracks field engagement, hesitation, duration, revisits and abandonment, however, there is a neat Conversion Report which concisely shows the effectiveness of a particular form, by highlighting how many visitors make it through each stage of the form.
Inspectlet allows you to tag users, sessions and event specific events, which when coupled with the extensive session filters, provides a very power toolset for drilling down into your recordings.
Contentsquare
Website: http://www.clicktale.com
Pricing: On request.
The last of the big players on this list along with LuckyOrange and Inspectlet. Again, as with the others, ClickTale covers all the bases and covers them well; session recording and replay; excellent recording filtering; website heat mapping with click, motion and scroll; conversion funnels; form analytics; mobile and tablet tracking and a whole bunch of integrations with other platforms.
ClickTale also has time on its side as it’s been around for some years now which means as a platform, it has absolutely everything you need, a great team developing new and improved features and a solid support team.


